There are many visualizations of the COVID-19 outbreak, including
Tableau resources and an
online dashboard from John Hopkins Center for Systems Science and Engineering (CSSE). I hadn't found a source for the Salesforce Analytics enthusiast out there. So I decided to build my own and share it with the community.
Data Source
I started with 2019 Novel Coronavirus COVID-19 (2019-nCoV) Data Repository by Johns Hopkins CSSE, which is available as a github
project.
The repository includes time series files that report confirmed, deaths and recovered by country and state/province. There were a few challenges with the data format, as each new day of data is a separate column. Einstein Analytics prefers data in denormalized format, with the date as a row of data.
In addition, some of the columns had missing data, such as as the state/province not applying in certain country. When displaying data on maps, Einstein Analytics is particular about the name of the country or region. There were a few places the required adjustments. Sorry Czechia, I had to change you to Czech Republic.
Next, the granularity of data changed over time. For example, in the United States data was reported at the county level (King County, WA) before switching to be at the state level (Washington) about a week ago.
I decided to give Python a try to modify the data before uploading. While I am not an expert, it was pretty easy to do replacements with pandas DataFrame replace and then melt to change the daily data into rows.
Einstein Analytics
With data ready to analyze, it was time to upload the csv file. Next, there are a few metrics that I wanted to calculate with a dataflow, such as the first date of a confirmed case in a country or state as well as the number of days since the first confirmed case. Using a compute relative and compute expression in the dataflow helped meet this need.
With the data ready, it was pretty easy to create a dashboard of insights. Like most analytics projects, this was an iterative process. The dashboard that started with one map and one chart, now has three tabs showing similar data at the global, US and Europe levels.
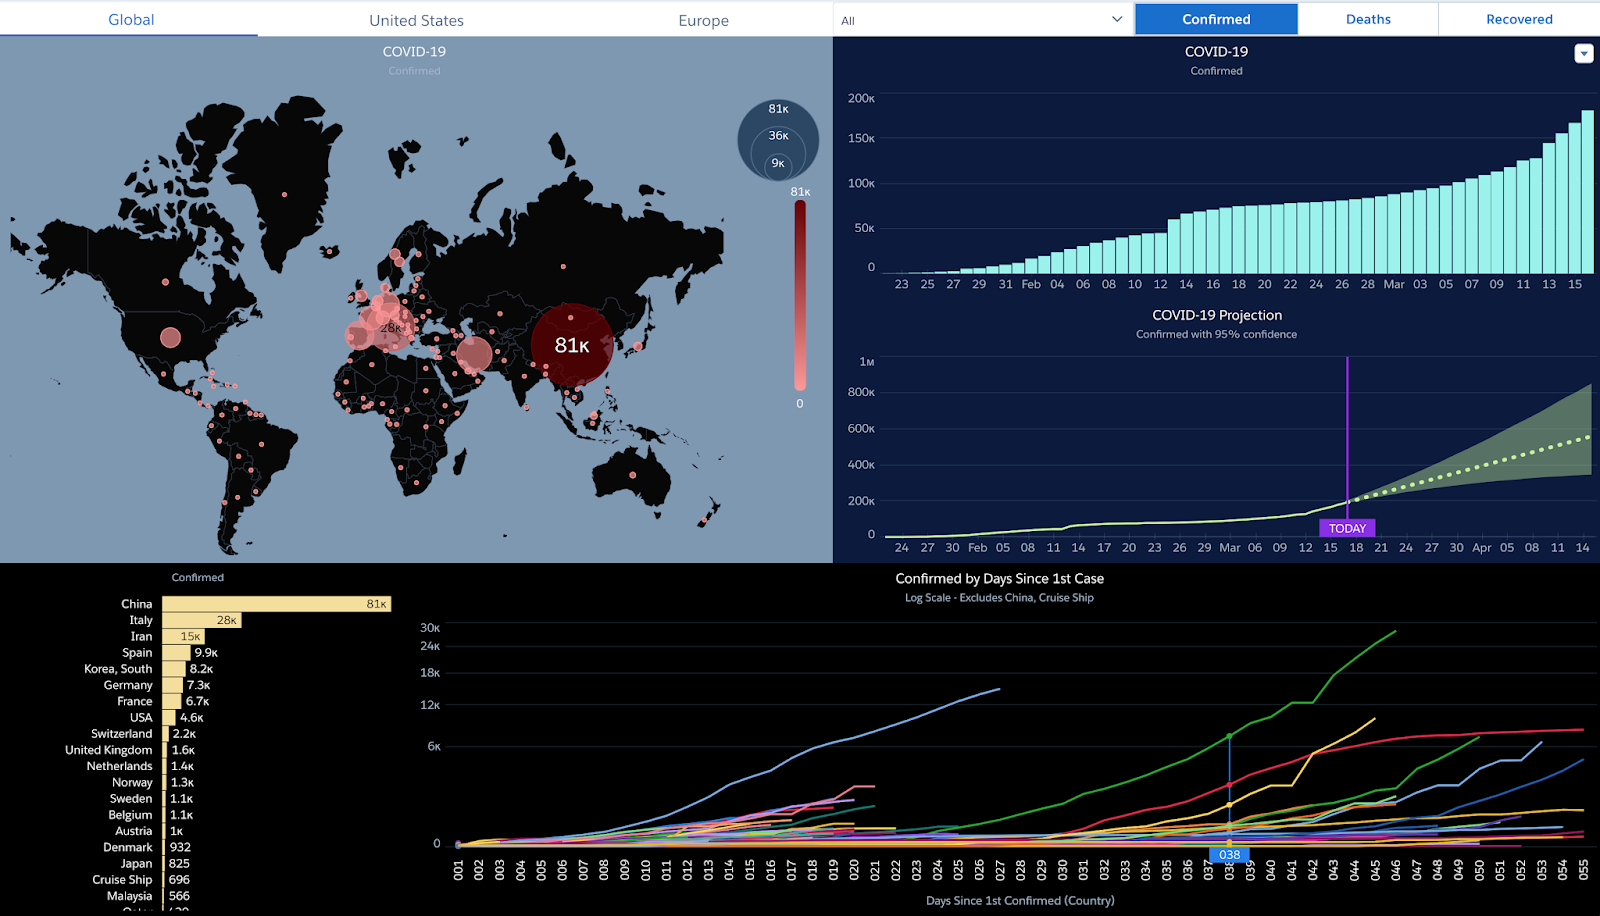
There is also the ability to switch between confirmed cases, deaths and recovered patients. The dashboard currently shows the following visuals:
- Map of metrics
- Growth over time
- Time series prediction of the next 30 days
- Country or state ordered by metrics
- Comparison over time by country or state based on the first confirmed case
A special note on the time series prediction. This can vary widely based on the available data points. There are confidence intervals based on the forward projection. Be sure to use this information with a critical eye and I sincerely hope some of the projections here are grossly inflated.
Installation
Finally, I packaged the Analytics Template into a managed package. Once you install the package, you can create a new App in Einstein Analytics.
- Navigate to Einstein Analytics
- Create App from Template
- Select COVID-19 app
- There are no options to select, simply provide a name
- Once the template setup completes, you are ready to go
The app will install a dataset from the csv file and use a dataflow to enhance the metrics. You can then view the associated COVID-19 dashboard.
Prerequisites
The following should be enabled before installing the package.
- Einstein Analytics enabled (Setup | Feature Settings | Analytics | Getting Started)
- Enable Analytics Templates (Setup | Feature Settings | Analytics | Settings)
- Manage Templated App System Permission
- Create a Permission Set and assign to your user
Install the managed package from the following links. Each day's data is represented as a new version.
- 4.10
- 4.7
- 4.4
- changed new by country to be growth rate (new/prior)
- added new by state for US
- data update
- 3.32 (April Fools Day)
- 3.31
- added new by country to global
- data update
- 3.30
- 3.28
- used the daily data to rebuild the dataset!
- fixed date rollover with GMT and blank maps
- data update through 3/28
- John Hopkins deprecated the data file and has created new formats. Will need to rework the data acquisition layer when I have time available.
- 3.23
- added ability to change duration metric
- data update
- 3.20
- 3.19
- includes new case measure
- updated dashboard visuals
- corrected confirmed by state 1st case
- data update
- note: source data does show decrease for Washington from the prior day
- 3.18
- correct South Korea and includes Confirmed New Cases measure
- data update
- 3.17
Upgrading
If you've already installed a package, the steps to upgrade are the following
- Install the latest managed package. You will be prompted to upgrade while preserving data
- Within your Einstein Analytics app, there will be an option to update
- Click New version is available and decide to create a new app or update the existing one
- This will update the latest analytics assets
Data updates
The app template update does not update the Covid Raw Data set with the latest version of the csv. You can either create a new app to get the latest or update the data manually.
Data files and associated schema .json file is available on my github
repository.
- Click on Covid Raw Data and select Edit
- Use the Replace Data option
- Specify the covid.csv
- Specify the covid.json Data Schema File
- Click upload
After the file is loaded, be sure to execute the dataflow to update the Covid Enhanced dataset. Read more about automating the process in
this post.
Feedback
Give it a try and let me know what you think. Feedback is welcome and appreciated - leave a message in the comments.
Visualization Evolution
A quick run down of changes to the dashboard
3.19 Dashboard
3.31 Dashboard