Tuesday, August 1, 2017

Analytics Explained - Compare Table Unleashed

The compare table, only good for showing boring rows of data, right? Definitely not the case! The compare table has more to offer than it first appears.

I've created an unmanaged package that explores how to unlock the full power of the compare table, no SAQL coding required. Learn how drive better insights in Einstein Analytics through the following:

- Building killer dashboards without writing code

- Creating advanced compare table charts, such as timeline charts with separate lines by year

- Tips and tricks for creating formula columns and using functions

- Leveraging advanced functions for rankings, period over period changes and running totals

- Strategies to handle null values and turn 'No Results Found' into zeros


Monday, April 24, 2017

Summer 17– Hottest Analytics Cloud Features

s17As the weather heats up, thoughts turn toward Summer.  After reviewing the release notes and working in a pre-release org, here are the hottest features coming in the Analytics Cloud Summer 17 release.

Wednesday, April 12, 2017

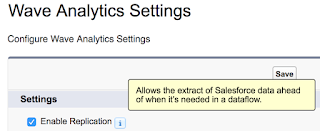
Salesforce Wave Explained - Replication


Salesforce Analytics Cloud includes a replication feature that will pre-populate Wave with Salesforce data.  Replicated data can greatly improve dataflow execution times.

Enabling replication also consolidates multiple digest statements in dataflows into a single extract.  If you have used the Dataset builder and selected the same object more than once, your dataflow will digest that object multiple times.

Simply check the option and away you go....well almost.  There are a few considerations to take into account when using replicated data.  Here's what to keep in mind as well as a list of my Tips & Tricks.

Tuesday, March 21, 2017

Salesforce Wave Explained - Independent Chart Comparison


A client recently requested the ability to look at two charts on the same dashboard in Salesforce Analytics Cloud, each with its own set of date ranges.  For example, being able to look at average sales amount for the current year in one chart and the prior year in another chart.

While this may seem like a daunting request at first, it's actually quite simple to build this dashboard.  In fact, it can be done without any SAQL and only a few lines of JSON.  Here is how to build it.

Thursday, February 2, 2017

Salesforce Wave Explained - XMD 2.0 Migration

The Winter 17 Salesforce release included a new format for Extended Metadata (XMD), which is used to customize the formatting of dashboard elements in Wave Analytics.  The pre-Winter 17 version is known as XMD 1.1, while the new format is XMD 2.0.

In addition to the format change, XMD became a Base Platform Object, rather than a JSON file on the dataset.  You still use JSON to specify and upload the XMD.  As a Base Platform Object, you can manipulate JSON through APIs, such as the REST API through workbench.  It also means the XMD format and contents are validated, allowing only correct JSON files to be uploaded.

While there is an XMD Overview and Reference guide in the developer documentation, some of the examples still retained the 1.1 format.  There is also a help document that discusses the transition from 1.1 to 2.0, which give before and after pseudo code.  

What I did not find were before (1.1) and after (2.0) examples for transforming each section of an existing XMD 1.1 file.  Here is my outline for turning XMD 1.1 into XMD 2.0, section by section, with before and after examples.

Wednesday, January 25, 2017

Analytics Cloud Solved - Failed to Register 1 Files

Recently, I was working to update datasets in Salesforce Analytics Cloud. Some of my fields in the dataset were changing to support new functionality.  

As part of the changes, some of the attributes and measures in data set were removed and new fields were added.  While working with Wave is usually smooth sailing, this time I encountered rough waters.