
Analytics Playground
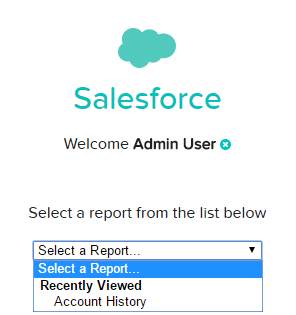 If you have tried the Analytics Playground yet, now is a great time to try it out. You can go through a tutorial and try out Analytics Cloud features. Best of all, you can even start exploring your own data. This can be an Excel or CSV file you upload or a Google doc you connect to. Now, you can even connect to your Salesforce org and select an available report that you have created. Nothing compares to analyzing your own data in the playground!
Wave Dashboards in Salesforce

Additionally, there is now a <wave:dashboard></wave:dashboard> tag that can be embedded in Visualforce pages. For example, display a dashboard on the home page with the following,
<wave:dashboard dashboardId="{dashboard id}" height="400px"></wave:dashboard> in a
Quick Actions in Lenses & Dashboards

Post to Chatter
Chatter is also included in the integration party. From a Wave dashboard, a Chatter post can be created that includes both the dashboard image and a link to the dashboard. Users can access the image within Chatter to see the dashbaord details and then us the link to dive into the analysis.
Sales Wave (Pilot) & Service Wave (Limited Pilot)
As getting started with Analytics can be daunting to many, Salesforce is releasing targeted templates to get you started. These templates contain the components needed to answer common questions. The Sales Wave App gets you running in about the time it takes to get a coffee. After answering a handful of questions presented in a wizard like interface, an Analytics Cloud App is created along with the datasets, data flows, lenses and dashboards to analyze the sales side of your business from any device.Sales Wave enables you to review and analyze your Forecasts, Pipelines, Team Coaching and an overall Business Review. All of the topics are personalized based on the questions you answered. For example, if you pick Industry as your primary method of Account segmentation, it is an available filter in the dashboard. Best of all, the data is refreshed daily which lets you keep a pulse on your business. A similar, but much more limited pilot, is underway to pull in data from the Service Cloud for analysis.
Limit Changes
Summer ‘15 Plus included increases that allow additional data loading. The maximum number of dataflow jobs in a rolling 24 hours has been increases from 10 to 24. This is a welcome improvement, as both failed and successful jobs count towards the limit. When working to get a data extract right, I have hit this 10 data load limit before. Additionally, the maximum number of external data uploads in a rolling 24 hour period has increased from 20 to 50.
Several new or changes limits also come with Summer ‘15 Plus. First, there is a maximum amount of external data to load, which is set to 50 GB. Finally, the maximum length for dataset field names based on a CSV file has been decreased to 40 characters from 255. This is a important change to take note of, as it can affect your datasets.
SAQL Enhancements
For those of us that push the Analytics Cloud to do more by writing SAQL, take note of the Use More Robust Syntax feature. This release introduces more robust syntax checking to prevent errors when executing SAQL code, which is a nice improvement. However, the changes may break existing SAQL code, which requires you to review and update your code. Be sure to check out the release notes for full details of what has changed. All of the breaking changes are called out.
- min() and max() functions only take measures as arguments
- Can't group a grouped stream
- Can't reference a pre-projection ID in a post-projection order
- Can't have two consecutive order statements on the same stream
- Quotations mark rules applied consistently
- Changes to foreach statement
- count() function takes grouped source stream as an argument
- SAQL queries must be compositional
- Filtering an empty array returns and empty result
- Explicit stream assignment required
- Out of order range filter returns false
What’s Next
With all the new features in Summer ‘15 Plus, it’s exciting to be working with the Analytics Cloud. I am excited to see tighter integration with Salesforce. Now when an analysis finally finds the data in need of attention, you can quickly and easily take action. What’s your favorite new feature?
No comments:
Post a Comment